


Data and delivery
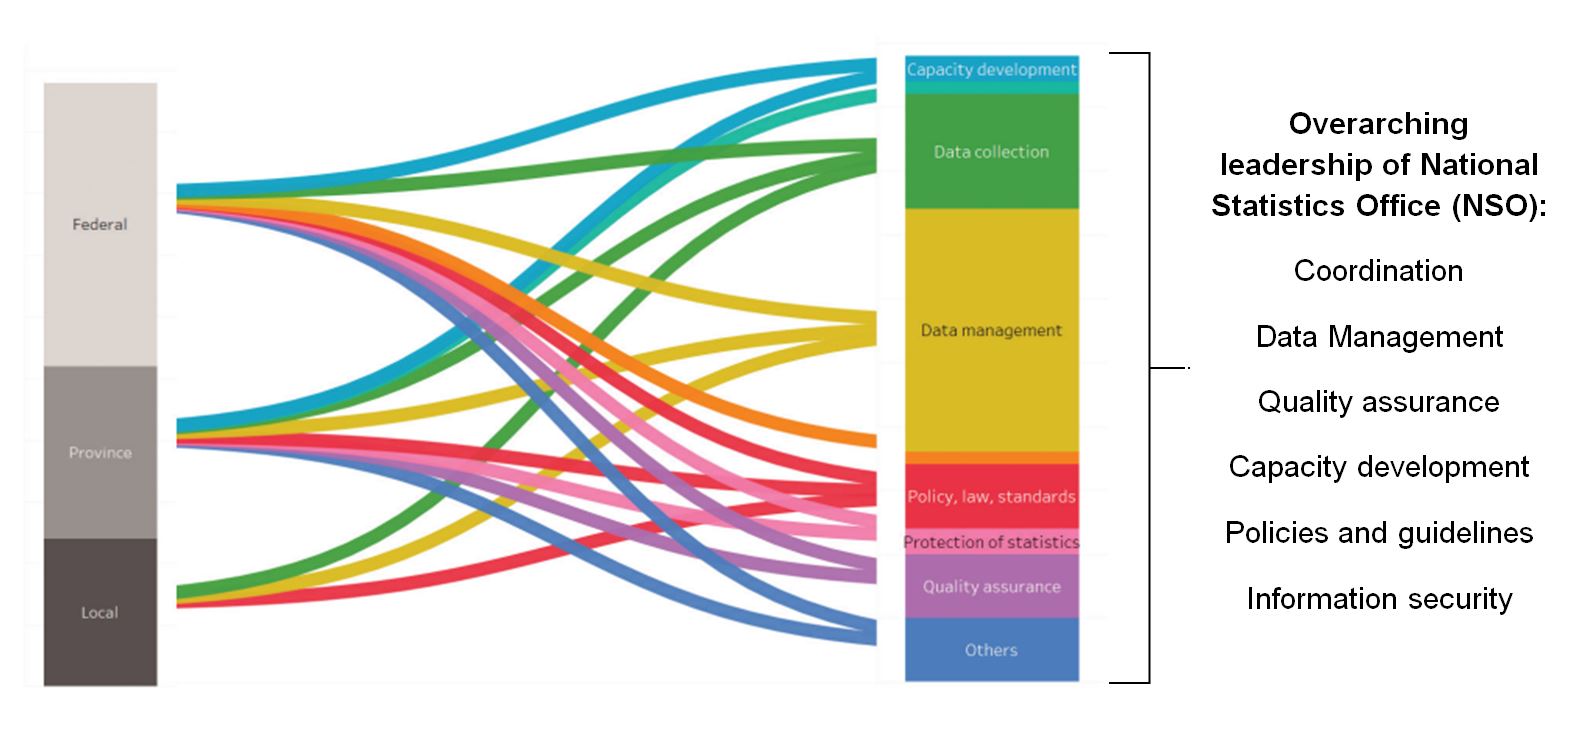
Identifying and minimising redundancies in Nepal's SDG indicators as the 2030 deadline nearsAs the 2030 deadline for the Sustainable Development Goals (SDGs) looms, Nepal faces a major challenge in monitoring its progress. With 446 indicators revised in June 2023, the list of SDGs in federal Nepal shoots up sevenfold at the provincial level and a hundredfold when all 753 local bodies are taken into account. This massive reporting burden, along with overlapping data collection authorities, can erode the quality of data (Figure 1).
Furthermore, the World Bank report on envisioning a future data ecosystem in federal Nepal states that ‘The data governance should be institutionalized in such a way that data coming from different sources would ‘complement’ rather than ‘compete’ with each other and abide the ‘cooperation’ ‘coexisting’ and ‘coordination’ principle enshrined in the Constitution of Nepal’.
However, the challenge is to ensure reporting efficiency and quality, especially as the statistical regulation of 2080 B.S. allows independent data collection, but the localisation of SDG indicators creates a huge administrative ordeal. As such, it is important to map the overlapping SDGs indicators, and explore the scope for minimising redundancies by reducing the number of repeating indicators and duplication of efforts, as well as identifying complementing indicators.
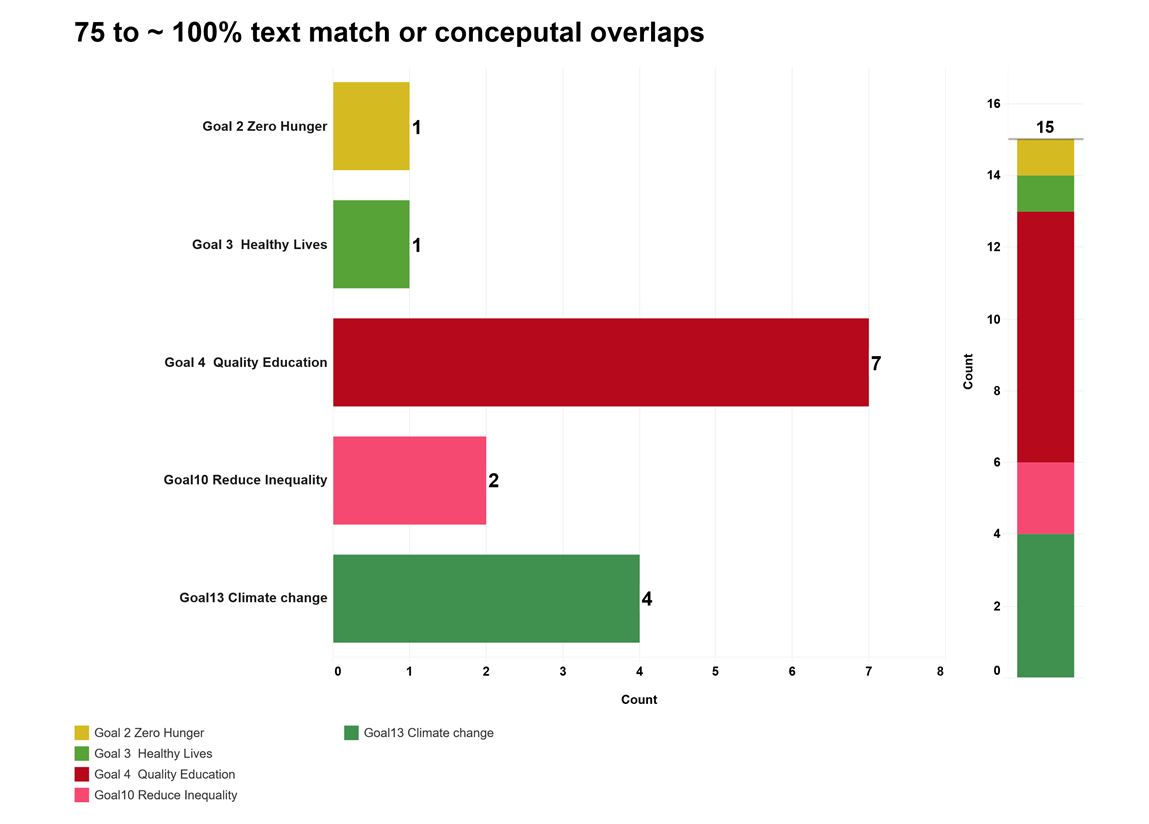
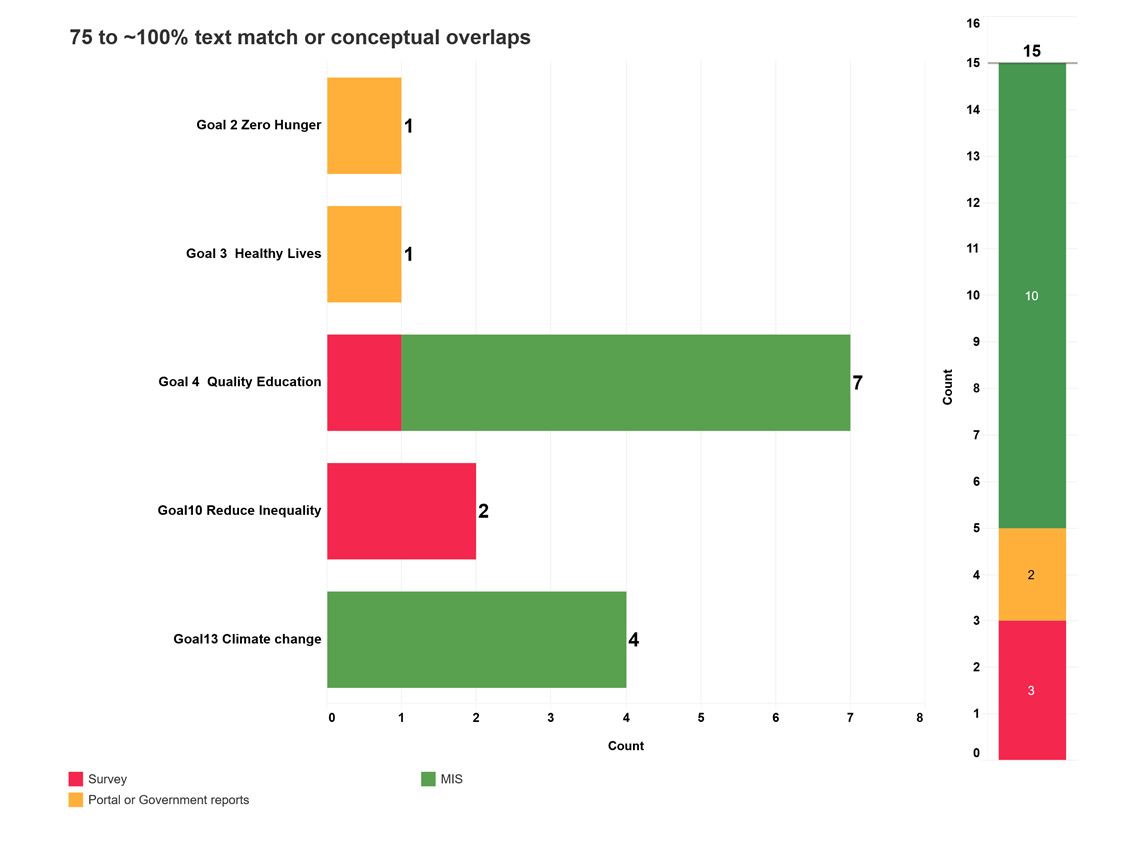
There are 15 indicators with a 75-100% text match or conceptual overlap across different goals (Figure 2). For instance, SDG 4, Indicator 1.4.3 “Households within 30 minutes travel time to health facility (% of total)” is conceptually identical to SDG 3, Indicator 3.8.9 “i. Percent of households within 30 minutes travel time to health facility”.
In another example of duplication, “Number of deaths, missing persons and directly affected persons attributed to disasters per 100,000 population,” is reported in both SDG 13 Indicator 13.1.1 and SDG 11 Indicator 11.5.1. The count of “local levels that adopted disaster risk reduction strategies,” appears in both SDG 11 Indicator 11.b.2 and SDG 13 Indicator 13.1.3.
The problem is not just duplication, but also conceptual overlaps: 55 indicators have more than 35% text similarity (Figure 3). For example, SDG 5, Indicator 5.5.3 “Women in civil service decision-making positions (% of total employees)” and SDG 16, Indicator 16.7.3 “Proportions of decision-making positions held by women in public institutions” are complementary. Technically, it should be possible to calculate indicator 16.7.3 if data is available in SDG 5.5.3, eliminating the need for separate reporting.
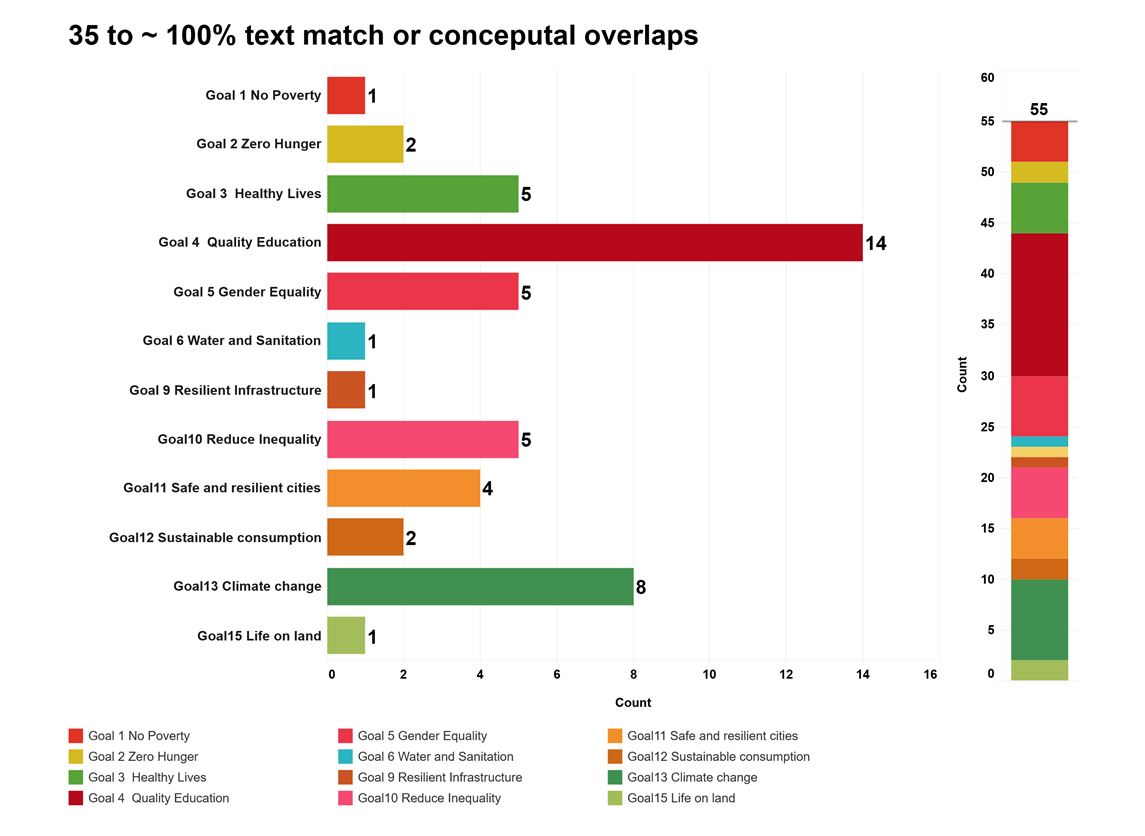
Furthermore, inherent interlinkages between indicators, such as SDG 1’s “Households having access to market center within 30 min walk (% of total)” and SDG 8’s “Access to Cooperatives (% of households within 30 min walk),” should complement each other, highlighting opportunities for data integration. Cooperatives operate within the proximity of the market, the existence of data in cooperatives and data gaps in access to the market or larger variation in statistics should flag the possible disconnect.
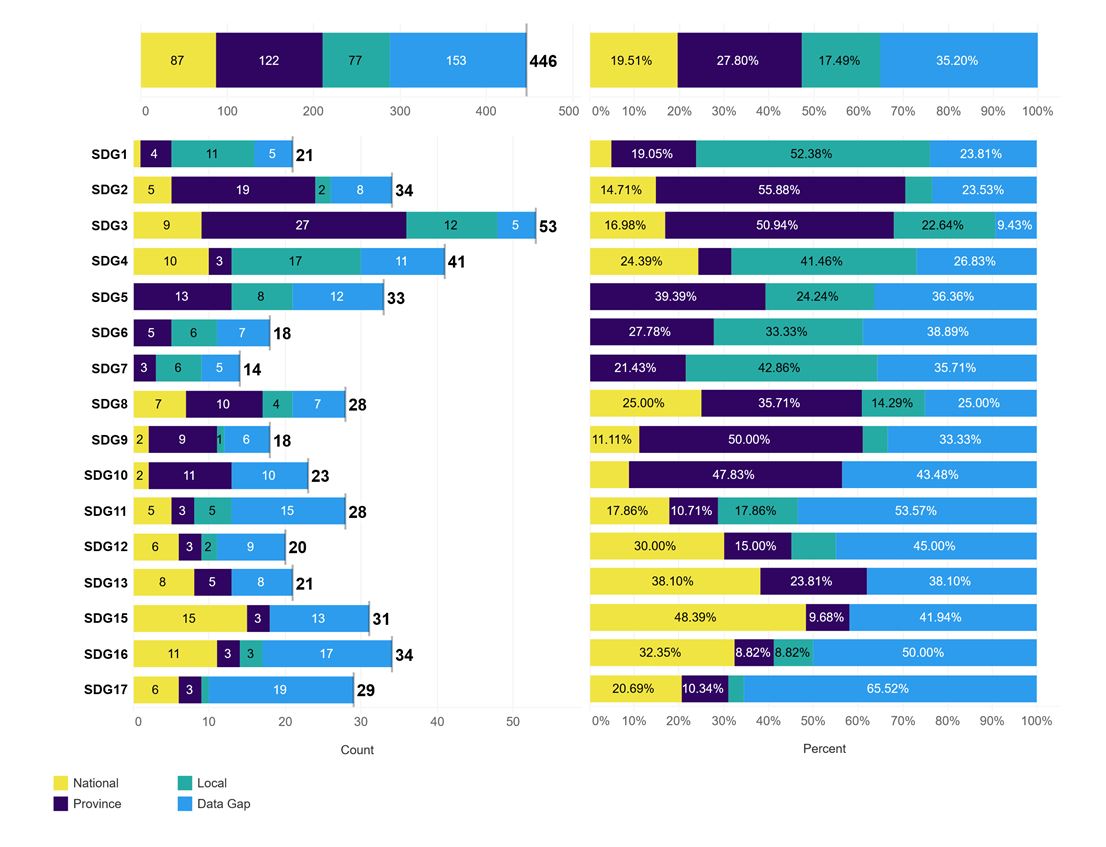
Meanwhile, there are more than three Goal Areas (SDG 11, 16 and 17) where the data gap is 50% or higher. In contrast, Health (SDG 3) and Education (SDG 4) have the highest number of indicators and the lowest data gaps, primarily due to well-established administrative systems like the Health Management Information System (HMIS) and the Education Management Information System (EMIS). These systems contribute approximately 38% of all data, with an overall data gap of 35%. Ministry of Health and the Ministry of Education have the highest proportion of budget followed by Ministry of Infrastructure.
The granularity of data is high in the SDGs 2, 3 and 4. These are the goal areas where MIS contributes the most. Overall, 18% of data is disaggregated at the local level, and approximately 28% at the provincial level (Figure 5).
Interestingly, indicators with matching text or conceptual overlaps often have no apparent data gaps and are highly disaggregated. This suggests that these indicators are often derived from administrative systems, and thus, a key opportunity exists to minimise redundancies by integrating these siloed systems (Figure 6).
However, it is easier said than done. Institutionalising interoperability across different administrative systems requires harmonised coding and coordinated data collection timelines. This task is made more difficult by the need for a sustained vision to push for digitisation with strong financial support, and a dedicated effort to identify indicators that do not share the same spelling or coding conventions.
While the revised SDG indicators now have unique identifiers, these must be consistently mapped across thematic areas and with existing administrative systems and ‘coding of newly established government units, including but not limited to the Central Bureau of Statistics, the Survey Department, and the High-Level Commission for Information and Technology (HLCIT) codes’. A lack of standardisation is a major obstacle. For instance, of the 753 local governments, only about 500 use the same spelling convention.
The Government of Nepal in 2022 graduated the Central Bureau of Statistics (CBS) to the National Statistics Office (NSO), making it a statistical arm to coordinate with federal units on the data collection, management and reporting process. The NSO is mandated to coordinate data collection and management in federal Nepal and to create a coordination committee for this purpose.
As per the regulation, the data coming from administrative services feeds into the unified statistical system. However, a critical gap exists: the mandate does not include representatives from the Ministry of Information and Technology (MoIT), where the integrated data management centre is hosted.
Mandate requires data to abide by the existing laws and practices in Nepal, and commensurate with the framework and definition laid out by the UN or its higher authorities. Furthermore, while the NSO's mandate calls for consistent frameworks and guidelines, it fails to mention the harmonisation of codes and identifiers—a basic requirement for a unified statistical system (section 2, sub-section 3 and sub-section 4).
One crucial step the government can take is to create a metadata that includes an exhaustive list of all the spelling conventions and coding used in the administrative systems of Nepal. This list should be reviewed by technical experts and think tanks to identify redundancies and overlaps in the SDGs indicators. This would be a foundational move toward a more efficient and integrated data ecosystem.
Ashutosh Mani Dixit co-authored the special focus section Envisioning a future data ecosystem in federal Nepal. He worked with the World Bank from 2018 to 2021, and the Government of Federal Nepal in SDGs agenda and localisation of the SDGs indicators.
The coding used for matching the text and spelling in the analysis is uploaded on GitHub. The data used in the analysis is available here for further discussion and feedback.